This week the International Monetary Fund published its July 2026 World Economic Outlook Update and chose a title that said everything: Global Economy in Crosscurrents of War and Technology. Not a single trend, not a synchronised cycle. Two forces pulling in opposite directions, and countries, markets, and assets falling on one side or the other.
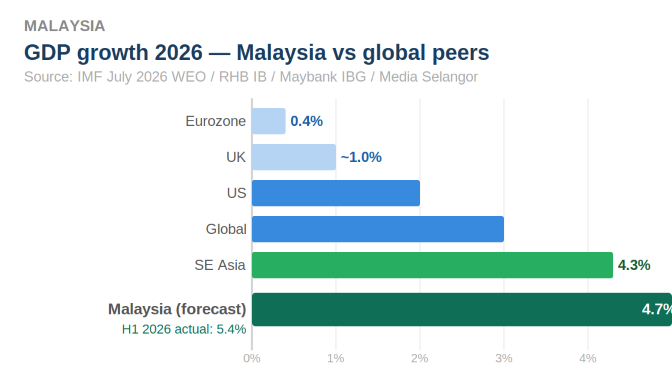
The IMF revised global growth down to 3.0% for 2026 and revised global inflation up to 4.7%. Disinflation has stalled. But buried inside the same report is something more interesting: the top net exporters of AI-related hardware posted a 4.4 percentage point average first-quarter growth surprise. The rest of the world posted negative 0.3 percentage points. That gap is not noise. It is the two-speed economy made visible in a single data point.
Understanding which lane a market is in right now matters more than understanding the aggregate. If you own assets in the wrong lane, the macro headwind is structural, not cyclical. If you own assets in the right lane, the tailwind compounds independent of what is happening in the Strait of Hormuz or what the Fed chair says next week.
This edition covers:
- The IMF's July 2026 two-speed framework and what it actually means for capital allocation
- The Lane One economies caught in the war and inflation trap, and why the exit is not straightforward
- The Lane Two economies accelerating on the back of the global AI and technology upcycle
- What the split means specifically for commercial property across offices, logistics, and urban assets
- Separated market updates for New Zealand and Malaysia, each with their own data context
1. The IMF's New Map of the World
The July 2026 WEO carries a headline growth figure of 3.0% for 2026 and 3.4% for 2027. What the headline obscures is the composition. It is the mathematical result of two very different trajectories. On one side: the euro area at 0.4% growth, energy-intensive economies under pressure, and markets where inflation has not returned to target. On the other: Malaysia at 4.7%, Southeast Asia at above 4%, South Korea upgraded on AI hardware exports, and four Asian economies that each outperformed Q1 growth forecasts by more than four percentage points.
The IMF identified the driver precisely. Countries with strong exposure to AI investment, digital infrastructure, and technology manufacturing are demonstrating resilience that is not yet built into the short-term baseline. The technology investment cycle is providing a strong offset to the war shock, but that offset is geographically concentrated. Economies positioned in the technology value chain are capturing it. Those that are not are absorbing the war and inflation shock without the counterbalancing tailwind.
The Strait of Hormuz is an energy story. The AI capital expenditure cycle is a technology story. Both are happening simultaneously, and which one dominates your market's outlook depends almost entirely on where that market sits in the global economy's structure.
"The IMF's July 2026 forecast is not a global average. It is two very different trajectories producing one misleading number. Investors who read the headline miss the most important information in the report."
2. Lane One: The War, Inflation, and Rate Trap
The eurozone is the clearest example of Lane One. Growth revised to 0.4% for 2026. Energy costs remain elevated relative to pre-war norms. Industrial competitiveness versus the US and China continues to erode. The ECB postponed rate reductions in March after Dutch TTF gas benchmarks nearly doubled. Germany's fiscal stimulus will not have its full effect until 2027.
The United Kingdom faces similar arithmetic. Inflation expected to breach 5% in 2026. GDP growth at the bottom of consensus at approximately 1%. The Bank of England's path back to target extends to mid-2027 at the earliest.
In the United States, Q1 2026 S&P 500 earnings growth came in at 27.8%, the strongest since Q4 2021, driven by Big Tech. But underneath the market surface, consumer confidence hit its lowest level since 2008, the US debt-to-GDP ratio has crossed 125%, and the ceasefire collapse on July 8 sent crude oil back above $87 per barrel, reversing weeks of post-ceasefire price relief. The Fed faces the same binary choice it has been circling for months: raise rates to defend the dollar and risk a bond market dislocation, or hold and accept sticky inflation. A new Fed chair appointment this month adds further uncertainty.
The structural characteristic of Lane One economies is that the energy shock has disrupted the disinflation trend that was in place since early 2024. Central banks that paused or reversed their easing cycles are not going to resume cutting quickly. The rate environment that investors were hoping would normalise has instead bifurcated: some markets are hiking, some are holding, and very few are credibly cutting.
| Market | Indicator | Figure |
|---|---|---|
| Eurozone | GDP 2026 | 0.4% |
| UK | Inflation 2026 | 5.0%+ |
| Global | Inflation (IMF) | 4.7% |
| Brent Crude | Jul 14 2026 | $87/bbl |
3. Lane Two: Technology, AI, and the Structural Upcycle
The second lane is defined by exposure to the global AI and technology capital expenditure cycle. Collectively, hyperscalers are spending over USD 700 billion on AI infrastructure in 2026 alone, nearly six times the investment made in 2022. Malaysia, South Korea, Taiwan, and Thailand are the four economies the IMF specifically named as top net exporters of AI-related hardware, a designation that reflects structural positioning built over years.
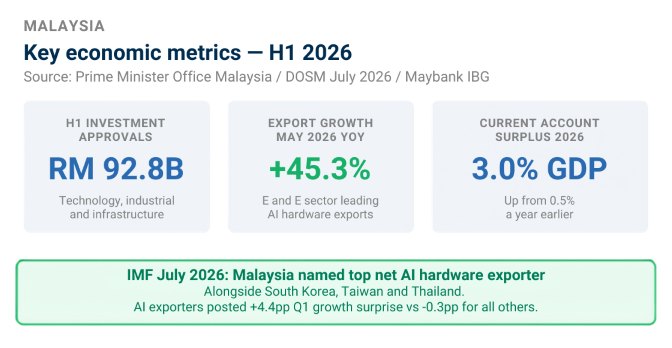
The H1 2026 data confirms what the IMF's designations implied. Malaysia's economy expanded 5.4% in the first half of 2026, driven by robust domestic demand, a 45.3% year-on-year surge in exports in May, and investment approvals reaching RM 92.8 billion in the first half alone. The current account surplus widened to 3.0% of GDP from 0.5% a year earlier. Maybank Investment Bank raised its 2026 GDP forecast to 4.9% from 4.4%. MBSB Research raised its forecast to 4.5% from 4.2%. Hong Leong Investment Bank raised its forecast to 4.7% from 4.5%. Three separate investment banks upgraded their Malaysia forecasts in the same week the eurozone was being revised down to 0.4%.
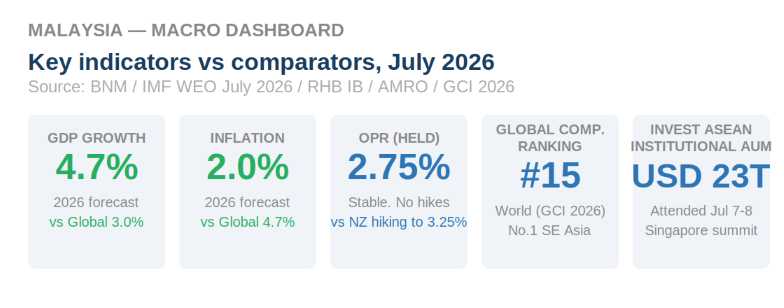
The Invest Asean conference held in Singapore on July 7 and 8 attracted approximately 200 institutional investors and prime brokerage clients representing a combined USD 23 trillion in global assets under management. Energy transition, supply chain reconfiguration, and AI-led digital transformation dominated the agenda. Attendance surpassed expectations, with sustained interest from both global and local investors in ASEAN as the region demonstrates resilience amid global uncertainties.
"Malaysia's economy expanded 5.4% in H1 2026. Three investment banks upgraded forecasts in the same week the eurozone was revised to 0.4% growth. That contrast is not a coincidence. It is the two-speed economy made visible."
| Market | Indicator | Figure |
|---|---|---|
| Malaysia | GDP H1 2026 (actual) | 5.4% |
| Malaysia | Investment approvals H1 | RM 92.8B |
| Malaysia | Exports growth May YoY | +45.3% |
| Malaysia | OPR | 2.75% (held) |
4. What the Two-Speed Split Means for Commercial Property
On offices: the global return-to-office wave is creating a structural repricing within the office sector. Research finds that 83% of global CEOs expect full returns by 2027. The more important data point for property investors is the quality split: buildings with superior amenity, connectivity, and specification are seeing rents hold or increase, while lower-quality stock continues to face vacancy pressure. In Lane One markets like New Zealand, quality offices in established corridors with committed tenants represent defensible income in a constrained growth environment. In Lane Two markets like Malaysia, Grade A office stock with MSC Cybercentre designation is absorbing genuine expansion demand from a technology sector tenant base that is structurally growing.
On logistics warehouses: the ASEAN warehousing and distribution logistics market is valued at USD 33.11 billion in 2026 and growing at 5.11% CAGR through 2031. The China Plus One strategy has moved from optional planning to mainstream practice, with bonded warehouses, free trade zones, and regional inventory positioning becoming standard tools for multinationals. For Malaysian logistics warehouses specifically, this creates a structural demand floor not dependent on any single tenant, industry, or economic cycle.
On urban commercial assets including car parks: the return-to-office trend creates specific demand for urban parking infrastructure. As commuters return to CBDs, utilisation of well-located urban car parks rises without requiring any capital improvement, lease negotiation, or tenant management. In a rate-hiking environment where the NZ OCR is now at 2.50% and heading toward 3.25%, assets that generate income without capital commitment or lease renewal risk carry a genuine premium.
"The two-speed economy does not make one market good and another bad. It makes the investment thesis for each market different. In New Zealand the case is income. In Malaysia the case is structural growth. Both are valid. The mistake is applying the same framework to both."
5. New Zealand: Market Update
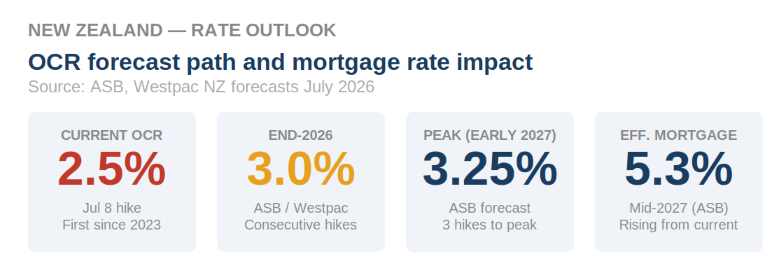
The defining event in the New Zealand market this month happened on the same day as the ceasefire collapse: July 8. The RBNZ lifted the OCR from 2.25% to 2.50%, the first rate increase since 2023. The direction of travel has now reversed.
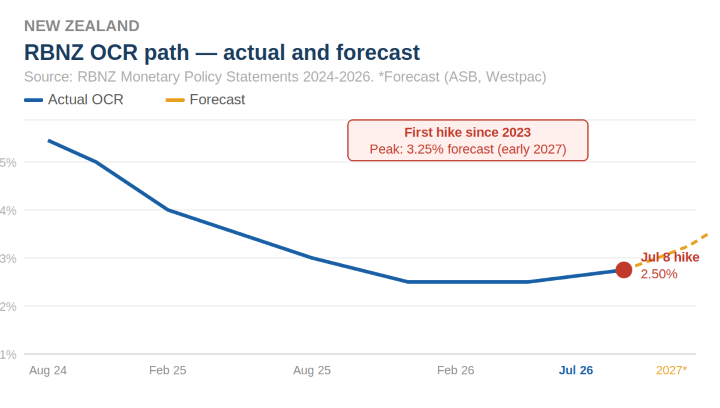
ASB economists have pencilled in consecutive 25 basis point hikes from September, with the OCR ending 2026 at 3.0% and peaking at 3.25% by early 2027. Westpac projects a similar path. ASB estimates the effective mortgage interest rate will reach 5.3% by mid-2027. REINZ has characterised the decision as bringing clarity rather than shock, noting that the market had largely priced in the direction of travel ahead of the announcement.
Within the property market, the regional picture provides necessary nuance. Canterbury continues to be the standout, recording a 3.0% annual HPI gain with a regional median of NZD 725,000, the second-strongest regional performance nationally. Christchurch's industrial and commercial precincts remain among the most active in the country, with industrial vacancy rates below the national average. Auckland recorded a negative 2.0% annual HPI and Wellington negative 1.6%, reflecting continued stock overhang and buyer caution in the major centres.
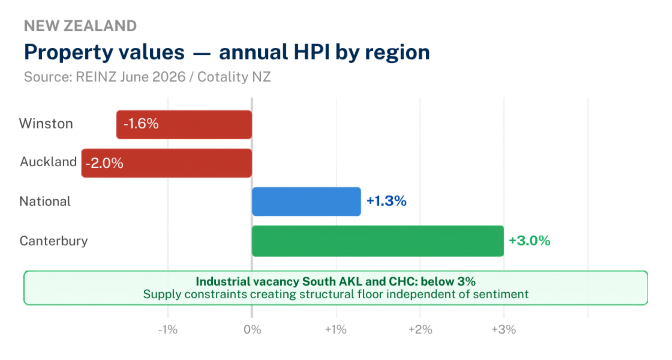
For commercial property investors, the rate hiking cycle concentrates the investment thesis further. Capital appreciation is not the story in New Zealand right now. Income is. Industrial assets in South Auckland and Christchurch where vacancy sits below 3%, urban commercial assets with committed tenants at current rents, and residential portfolio positions in precincts with genuine rental demand all represent the defensible income-first approach that this market rewards.
6. Malaysia: Market Update
Malaysia's H1 2026 performance, confirmed this week with actual GDP data showing 5.4% expansion, is the most concrete evidence available that the two-speed framework is not theoretical. This is a market where the fundamentals are performing in real time, not waiting for macro confirmation.
The IMF's July 2026 designation of Malaysia as one of four top net exporters of AI-related hardware, alongside South Korea, Taiwan, and Thailand, provides institutional validation for what the investment data has been showing. Approved investments for H1 2026 reached RM 92.8 billion. Exports surged 45.3% year-on-year in May. The current account surplus widened to 3.0% of GDP. The OPR remains stable at 2.75%. Inflation is contained at 2.0%.
The Invest Asean conference on July 7 and 8 in Singapore attracted institutional investors and prime brokerage clients representing USD 23 trillion in global assets under management. The dominant themes, energy transition, supply chain reconfiguration, and AI-led digital transformation, are all structural tailwinds for Malaysian industrial and commercial real estate.
For commercial property investors, the Malaysia story in July 2026 has two parallel tracks. The first is the data centre and AI infrastructure track, driving industrial land and warehouse demand in Johor and the Klang Valley corridors. The second is the corporate office track, where Malaysia's expanding technology, financial services, and professional services sectors are absorbing Grade A office space in established corridors at a rate supported by genuine economic expansion rather than sentiment. The flight to quality in Malaysian offices is being driven by tenant growth, not tenant consolidation.
The real yield available on Malaysian commercial assets, 5 to 7% nominal across office and logistics with inflation at 2.0%, produces a real return spread that developed markets cannot replicate.
7. Featured Listings: Strategic Entry Points
The following assets reflect the commercial property thesis outlined in this edition. Each sits within a segment where the fundamental case is already present: income-producing assets in a rate-hiking NZ market, and quality commercial stock in a structurally expanding Malaysian economy.
New Zealand
Auckland CBD — Purpose-Built Car Park Building
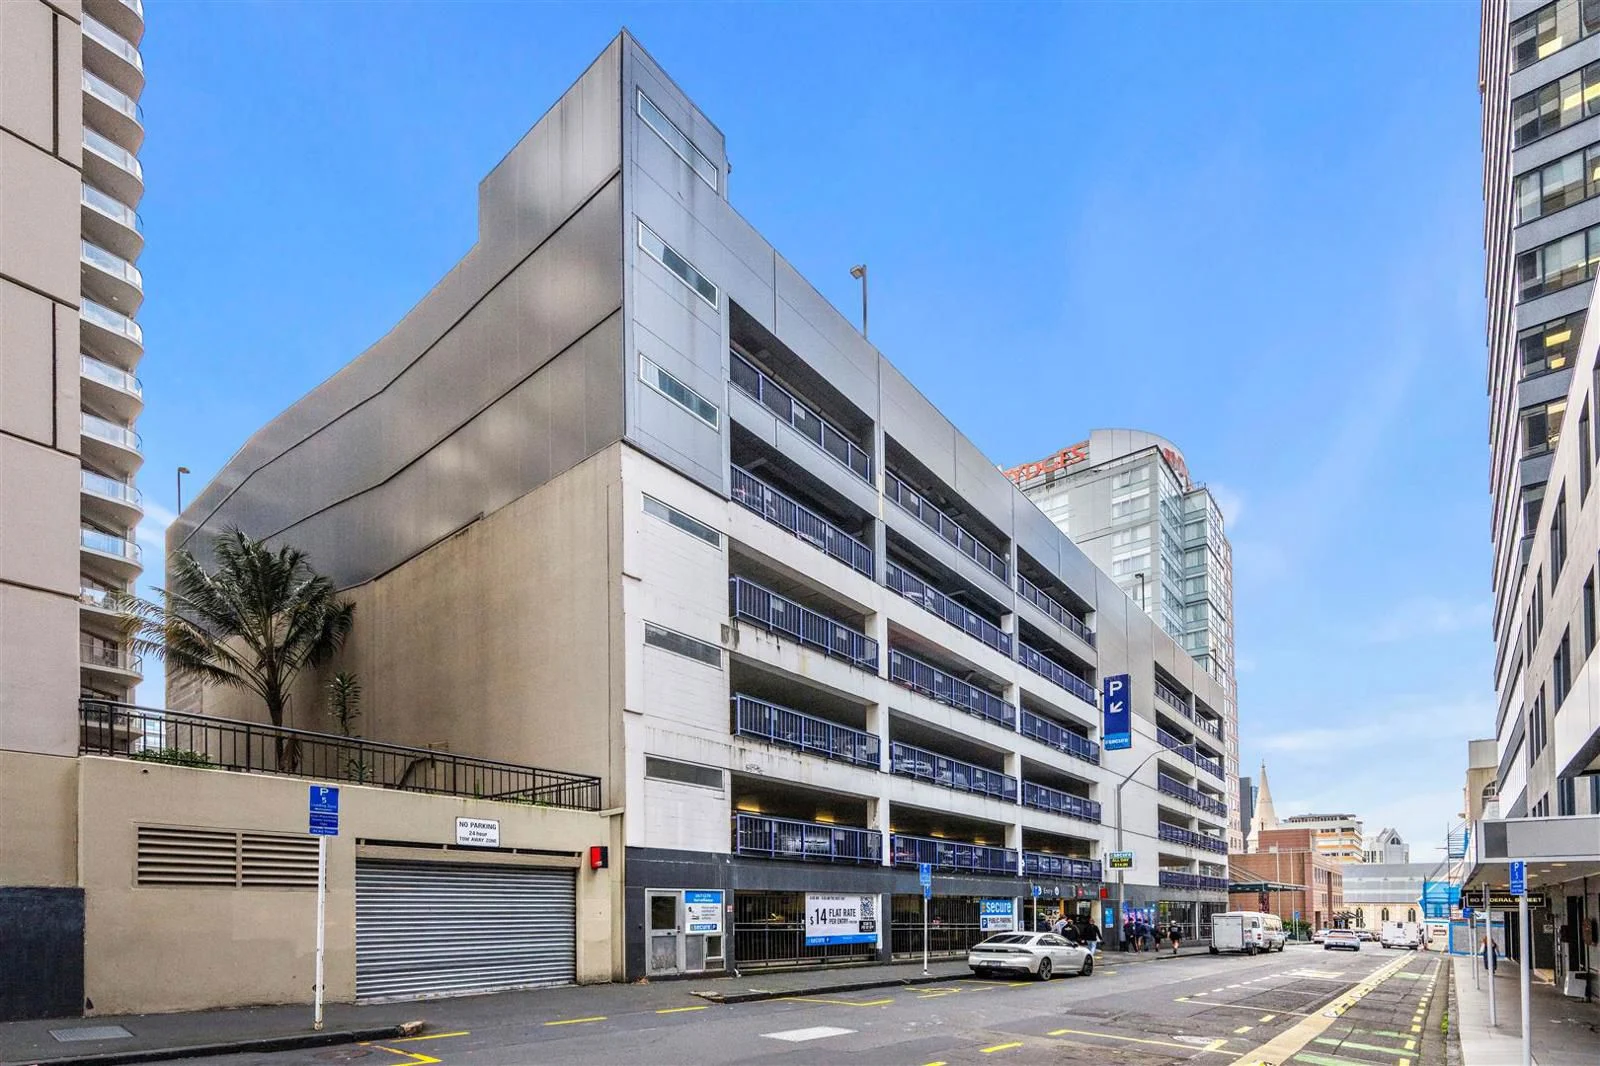
| Property Type | Commercial / Urban Car Park Building |
| Estimated Value | ~NZD 45M |
| Estimated Yield | ~6.5% |
| Land Area | ~1,641 sqm (Freehold, corner site) |
| Capacity | 435 spaces across 7 levels |
| Tenancy | Leased to a national car park operator (to April 2029) |
| Future Optionality | Resource consent for a 55-level residential-led mixed-use tower |
Notes: A purpose-built, seven-level freehold car park facility in the Auckland CBD, offering 435 spaces on a prominent corner site adjacent to the city's entertainment and hospitality precinct. The asset is fully leased to a national parking operator with built-in annual rental growth and a turnover rent component providing upside during periods of elevated utilisation. CBD parking supply is structurally constrained and expected to tighten further following the planned removal of a nearby competing facility. The freehold site carries resource consent for a large-scale residential-led mixed-use tower, providing significant future development optionality without requiring immediate capital commitment.
Investment Potential: The car park sector is one of the most underappreciated commercial asset classes in the current NZ cycle. It carries no fit-out capex, no tenant improvement budget, and no lease renegotiation complexity. In a rate-hiking environment where the OCR has just moved to 2.50% and is heading toward 3.25%, the premium on assets that generate income without ongoing capital commitment is material and growing. This asset sits precisely at the intersection of two converging trends: the return-to-office wave driving CBD commuter volumes back toward pre-pandemic norms, and the constrained supply dynamic created by the planned removal of a competing facility. The resource consent for future intensification provides an optionality layer that investors in New Zealand's development-constrained CBD pay a meaningful premium to hold.
West Auckland — Whole-Building Residential Investment Portfolio
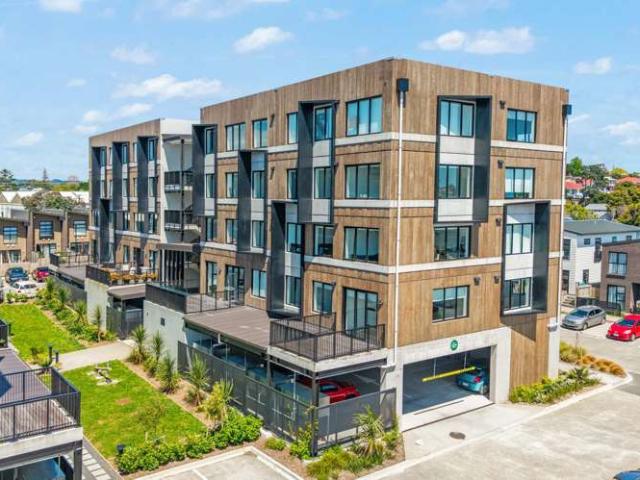
| Property Type | Residential Investment Portfolio |
| Estimated Value | ~NZD 16M |
| Estimated Yield | ~5.5% |
| Units | 32 x 2-bedroom, 1-bathroom apartments |
| Car Parks | 32 secure car parks (one per unit) |
| Rental Range | NZD 530-580 per week per unit |
| Occupancy | 50% tenanted, income from settlement |
Notes: A complete residential investment portfolio comprising 32 two-bedroom, one-bathroom apartments within a newly completed, purpose-built building in a well-established western Auckland suburb, approximately five minutes from the motorway. Each unit includes a secure car park and private storage locker. The building was constructed to a high standard with open-plan layouts strongly preferred by the rental market. The portfolio is offered as a single lot, providing concentrated whole-building ownership without the coordination complexity of acquiring individual units.
Investment Potential: Whole-building residential ownership at this scale in western Auckland is an unusual opportunity. The structure provides the efficiency of concentrated management, the resilience of diversified income across 32 tenancies, and the scalability of a purpose-built portfolio rather than an assembled collection of individual purchases. In the current NZ market, where the rate cycle has turned and capital appreciation has slowed, the investment case rests on income yield and vacancy risk management. A multi-tenancy residential building with strong rental fundamentals in a well-connected suburb absorbs the rate hiking environment more comfortably than single-asset positions.
Malaysia
Kuala Lumpur (Bangsar South) — Grade A Corporate Tower, En Bloc
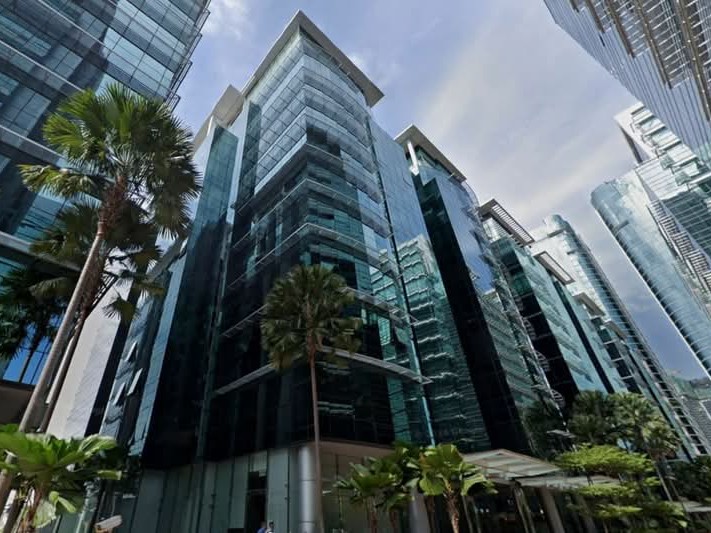
| Property Type | Grade A Commercial Office Tower (En Bloc) |
| Estimated Value | ~RM 228M |
| Estimated Yield | ~5.5% |
| Floor Area | ~247,000 sqft |
| Price per sqft | ~RM 923 psf |
| Tenure | Leasehold (98 years remaining) |
| Specification | Fibre-optic backbone, 100% power backup, dedicated high-speed lifts, CCTV |
Notes: An en bloc Grade A corporate tower in Bangsar South, one of Kuala Lumpur's most established and liquid office corridors, with direct connectivity to the KL Eco City, KLCC, and TRX precincts. The building is finished to full corporate specification including fibre-optic backbone, broadband from multiple providers, 100% electricity backup, dedicated high-speed lifts, and a multi-level car park. The asset is offered as a single en bloc title, presenting either an owner-occupier acquisition opportunity for a regional corporate or financial services firm, or a value-add repositioning play within one of KL's most active commercial precincts.
Investment Potential: Bangsar South has established itself as KL's most sought-after decentralised Grade A corridor, consistently absorbing demand from multinational corporations, financial services firms, and technology companies. In the context of the July 2026 article thesis, this asset sits directly in Lane Two: the expansion of Malaysia's AI, data, and technology tenant base is driving genuine office demand in quality corridors. With Malaysia's GDP confirmed at 5.4% H1 growth and approved investments at RM 92.8 billion in the first half of 2026, the macro context actively supports occupier demand in the months ahead.
Kuala Lumpur City Centre — 8-Storey En Bloc Commercial Building
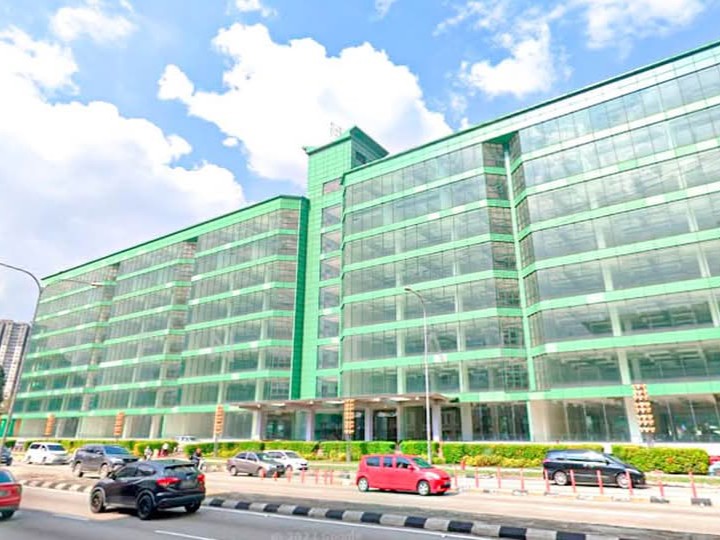
| Property Type | 8-Storey En Bloc Commercial Building |
| Estimated Value | ~RM 490M |
| Estimated Yield | ~5.5% |
| Floor Area | ~560,000 sqft |
| Price per sqft | ~RM 875 psf |
| Car Parks | 600 bays across 2 basement levels |
| Tenure | Leasehold (expires 2102) |
| Suitable For | Corporate office, retail, education, medical, commercial hub |
Notes: A substantial eight-storey en bloc commercial building on main road frontage in the KL City Centre precinct, offering 560,000 sqft of versatile commercial space with two basement levels providing 600 accessible parking bays. The building benefits from prominent main road visibility, centralized air-conditioning, 24-hour CCTV surveillance, passenger and cargo lifts, and designated loading bays. The leasehold runs to 2102, providing a 76-year remaining tenure that covers all practical investment horizons.
Investment Potential: Scale assets at this level in the KL City Centre precinct transact infrequently. The combination of 560,000 sqft on main road frontage with 600 basement car parks and a leasehold to 2102 represents a genuinely unusual market opportunity. The Malaysian commercial property market in July 2026 is absorbing genuine occupier expansion demand. With the IMF confirming Malaysia's GDP at 4.7% for 2026 against a global average of 3.0%, and the country named as one of four top AI hardware exporters globally, the corporate tenant pipeline into Kuala Lumpur's established commercial precincts is structurally supported.
Disclaimer: The information provided in this article is based on publicly available data and internal analysis. It is intended for informational purposes only and does not constitute financial or investment advice. Property details, financial figures, and projections are based on publicly available information and internal estimates and are indicative only. Readers should conduct independent due diligence and consult a qualified advisor before making any investment decisions. Fairhaven Property Group accepts no liability for decisions made based on the information presented herein.